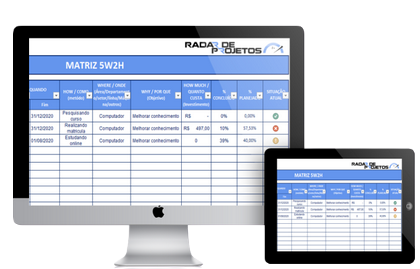
Project dashboards are essential for tracking performance, visualizing data, and keeping teams aligned. While premium project management tools can be costly, many free options provide robust features for creating professional dashboards without breaking the budget.
In this article, we’ll explore the best free tools for building project dashboards, their key features, and how to integrate them into your workflow.
Sumário
Why Use Project Dashboards?
Dashboards provide a visual representation of project data, making it easier to track progress, monitor resources, and identify risks. They offer real-time insights, ensuring project managers and stakeholders stay informed.
Key Benefits of Dashboards:
Visualizes Project Health – Clear charts and graphs provide a quick overview.
Enhances Communication – Keeps stakeholders updated with real-time data.
Improves Efficiency – Reduces the need for manual reporting.
Facilitates Decision-Making – Provides insights into project bottlenecks and risks.
Top Free Tools for Project Dashboards
1. Trello (With Power-Ups)
Overview: Trello offers simple project tracking using boards, lists, and cards. By adding free Power-Ups, users can create visual dashboards.
Key Features:
Task progress tracking
Integration with Google Sheets for reporting
Calendar and Gantt chart Power-Ups
Best For: Small to medium-sized projects that require task tracking and visual workflows.
2. Asana (Basic Plan)
Overview: Asana’s free plan allows teams to manage projects visually, with customizable dashboards to monitor progress.
Key Features:
Task and milestone tracking
Customizable project dashboards
Integration with over 100 apps
Best For: Teams managing multiple projects simultaneously.
3. ClickUp (Free Forever Plan)
Overview: ClickUp offers a powerful free version with a wide range of dashboard and reporting features.
Key Features:
Customizable widgets for progress tracking
Task dependencies and workload management
Real-time project insights
Best For: Agile teams and complex project management.
4. Microsoft Power BI (Free Tier)
Overview: Power BI enables users to build highly customizable dashboards using data from spreadsheets and databases.
Key Features:
Advanced data visualization tools
Real-time data syncing
Custom charts and graphs
Best For: Data-driven projects that require in-depth analysis.
5. Google Sheets (With Add-Ons)
Overview: Google Sheets can be transformed into a project dashboard using free add-ons and charting tools.
Key Features:
Interactive charts and graphs
Free project management templates
Real-time collaboration
Best For: Teams looking for a lightweight, customizable solution.
6. Notion (Free Personal Plan)
Overview: Notion combines note-taking, project management, and dashboard creation into one flexible platform.
Key Features:
Customizable databases for project tracking
Visual dashboards with linked pages
Drag-and-drop project views
Best For: Startups and small teams needing flexibility and organization.
7. Airtable (Free Tier)
Overview: Airtable allows users to create project dashboards using spreadsheets and database templates.
Key Features:
Visual project boards and calendars
Pre-built dashboard templates
Automation for repetitive tasks
Best For: Teams managing content, events, or product launches.

How to Choose the Right Dashboard Tool
Assess Project Complexity – Choose tools with features that align with your project needs. Simple tools like Trello work for small projects, while Power BI is better for data-heavy initiatives.
Evaluate Team Size – Consider the number of users supported by the free plan. Some tools cap users at 5, while others allow unlimited team members.
Look for Integration – Ensure the tool integrates with your current software (Slack, Google Drive, Jira).
Test Customization Options – Choose platforms that allow customization of widgets, charts, and data views.
Tips for Building Effective Dashboards
Keep It Simple – Focus on essential KPIs and avoid overloading the dashboard with unnecessary data.
Use Color Coding – Highlight urgent tasks and completed milestones using color indicators.
Automate Updates – Integrate dashboards with project management software to update data in real-time.
Review Regularly – Schedule regular reviews to update KPIs and reflect the current project status.
Real-World Example
A marketing agency managing multiple client projects adopted ClickUp’s free dashboard features. By tracking campaigns visually, the agency reduced project overruns by 25% and improved task completion rates by 40%.
Dashboards are not just for large enterprises—free tools make it easy for businesses of any size to manage projects more effectively.
If you want to continue exploring the topics discussed here, or simply want to connect with us and be part of our community, we invite you to follow us on our social media.
There, you’ll find exclusive content, regular updates, and the opportunity to engage in meaningful conversations.
Thank you for reading our article and we hope to see you on our social media soon. Together, we can continue to learn, share and inspire each other. Until then!
Instagram: @radardeprojetos
Pinterest: @radardeprojetos
Youtube: @radardeprojetos
My book: Implementing a Successful PMO
KPI FLIX: Your streaming of ready-made templates
Uncomplicated Action Plan Template


Deixe um comentário