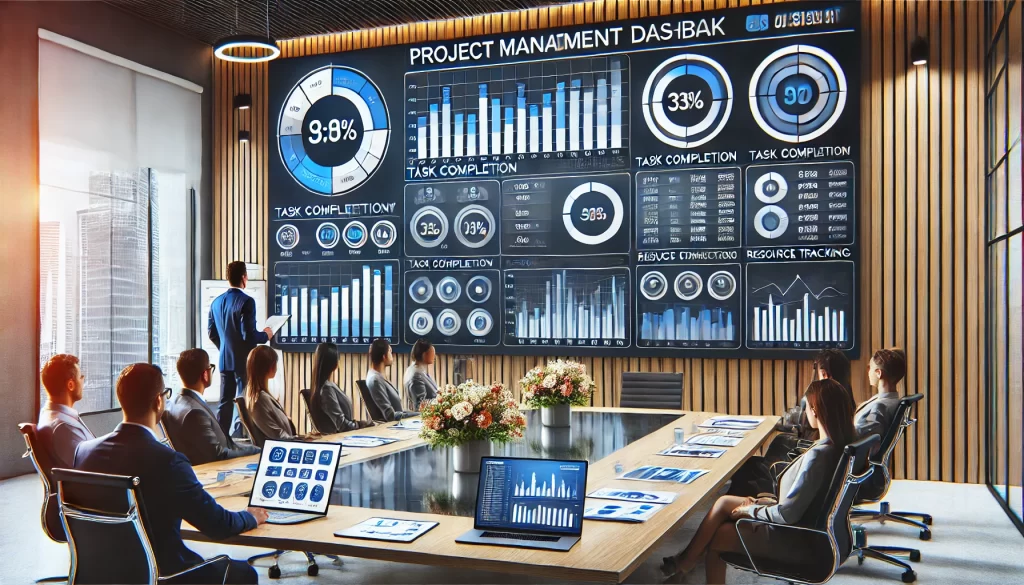
A project management dashboard is essential for tracking project progress, resource allocation, and performance metrics in real-time. It consolidates critical data into an easy-to-understand visual format, helping teams stay aligned and enabling managers to make informed decisions quickly.
In this article, we’ll cover the key components of an effective dashboard, tools you can use, and best practices for creating dashboards that drive project success.
Sumário
What is a Project Management Dashboard?
A project management dashboard is a visual representation of project data that provides insights into various aspects of project performance. It typically includes charts, graphs, and indicators that display information such as timelines, budgets, task completion rates, and risk levels.
Dashboards are often integrated with project management tools, allowing for automatic updates and real-time monitoring.
Key Components of a Project Dashboard
Project Timeline
A clear timeline tracks project phases, milestones, and deadlines, providing an overview of progress and upcoming tasks.
Task Status
Use color-coded indicators (e.g., green for completed, yellow for in progress, and red for delayed) to display the status of key tasks.
Budget Tracking
Visualize budget usage, compare planned vs. actual expenses, and forecast remaining costs.
Resource Allocation
Showcase team member workloads and resource distribution to ensure no one is overburdened or underutilized.
Risk Indicators
Highlight potential risks and their impact, allowing managers to mitigate issues early.
KPIs and Performance Metrics
Track project-specific KPIs such as task completion rates, productivity levels, and stakeholder satisfaction.
Tools for Building Project Dashboards
Microsoft Power BI
A powerful tool that integrates with various data sources and provides customizable dashboards. Ideal for complex projects requiring in-depth data analysis.
Tableau
Known for its robust data visualization capabilities, Tableau allows teams to create interactive dashboards with ease.
Monday.com
Offers simple, customizable dashboards for tracking project tasks, timelines, and team performance.
Asana
Features built-in dashboards that provide real-time insights into task progress and team productivity.
Trello
While primarily a task management tool, Trello’s Power-Ups enable dashboard creation for tracking project performance.
Steps to Create an Effective Dashboard
1. Identify Key Metrics
Determine which project metrics are most relevant. Focus on KPIs that reflect progress, risks, and resource allocation.
2. Choose the Right Tools
Select a tool that fits your project size and complexity. For smaller projects, simple tools like Trello or Asana may suffice. For larger projects, Power BI or Tableau might be necessary.
3. Design for Clarity
Ensure the dashboard is visually clean and easy to interpret. Use color schemes, charts, and graphs to present data in a digestible format.
4. Keep it Real-Time
Automate data updates to ensure the dashboard reflects the most recent project information.
5. Customize for Stakeholders
Create multiple versions of the dashboard tailored to different audiences. Executives may prefer high-level overviews, while project managers need detailed reports.
Best Practices for Dashboard Success
Simplicity is Key – Avoid overcrowding the dashboard with too much information. Highlight the most critical data points.
Regular Updates – Keep the dashboard current to ensure accuracy in reporting and decision-making.
Mobile Accessibility – Use tools that allow team members to access dashboards on mobile devices.
User Training – Ensure that all relevant team members understand how to interpret and use the dashboard effectively.
Feedback and Iteration – Continuously gather feedback from users and refine the dashboard based on their needs.
A well-designed project dashboard is more than just a reporting tool; it’s a vital component for project transparency, accountability, and success.
If you want to continue exploring the topics discussed here, or simply want to connect with us and be part of our community, we invite you to follow us on our social media.
There, you’ll find exclusive content, regular updates, and the opportunity to engage in meaningful conversations.
Thank you for reading our article and we hope to see you on our social media soon. Together, we can continue to learn, share and inspire each other. Until then!
Instagram: @radardeprojetos
Pinterest: @radardeprojetos
Youtube: @radardeprojetos
My book: Implementing a Successful PMO
KPI FLIX: Your streaming of ready-made templates
Uncomplicated Action Plan Template



Deixe um comentário